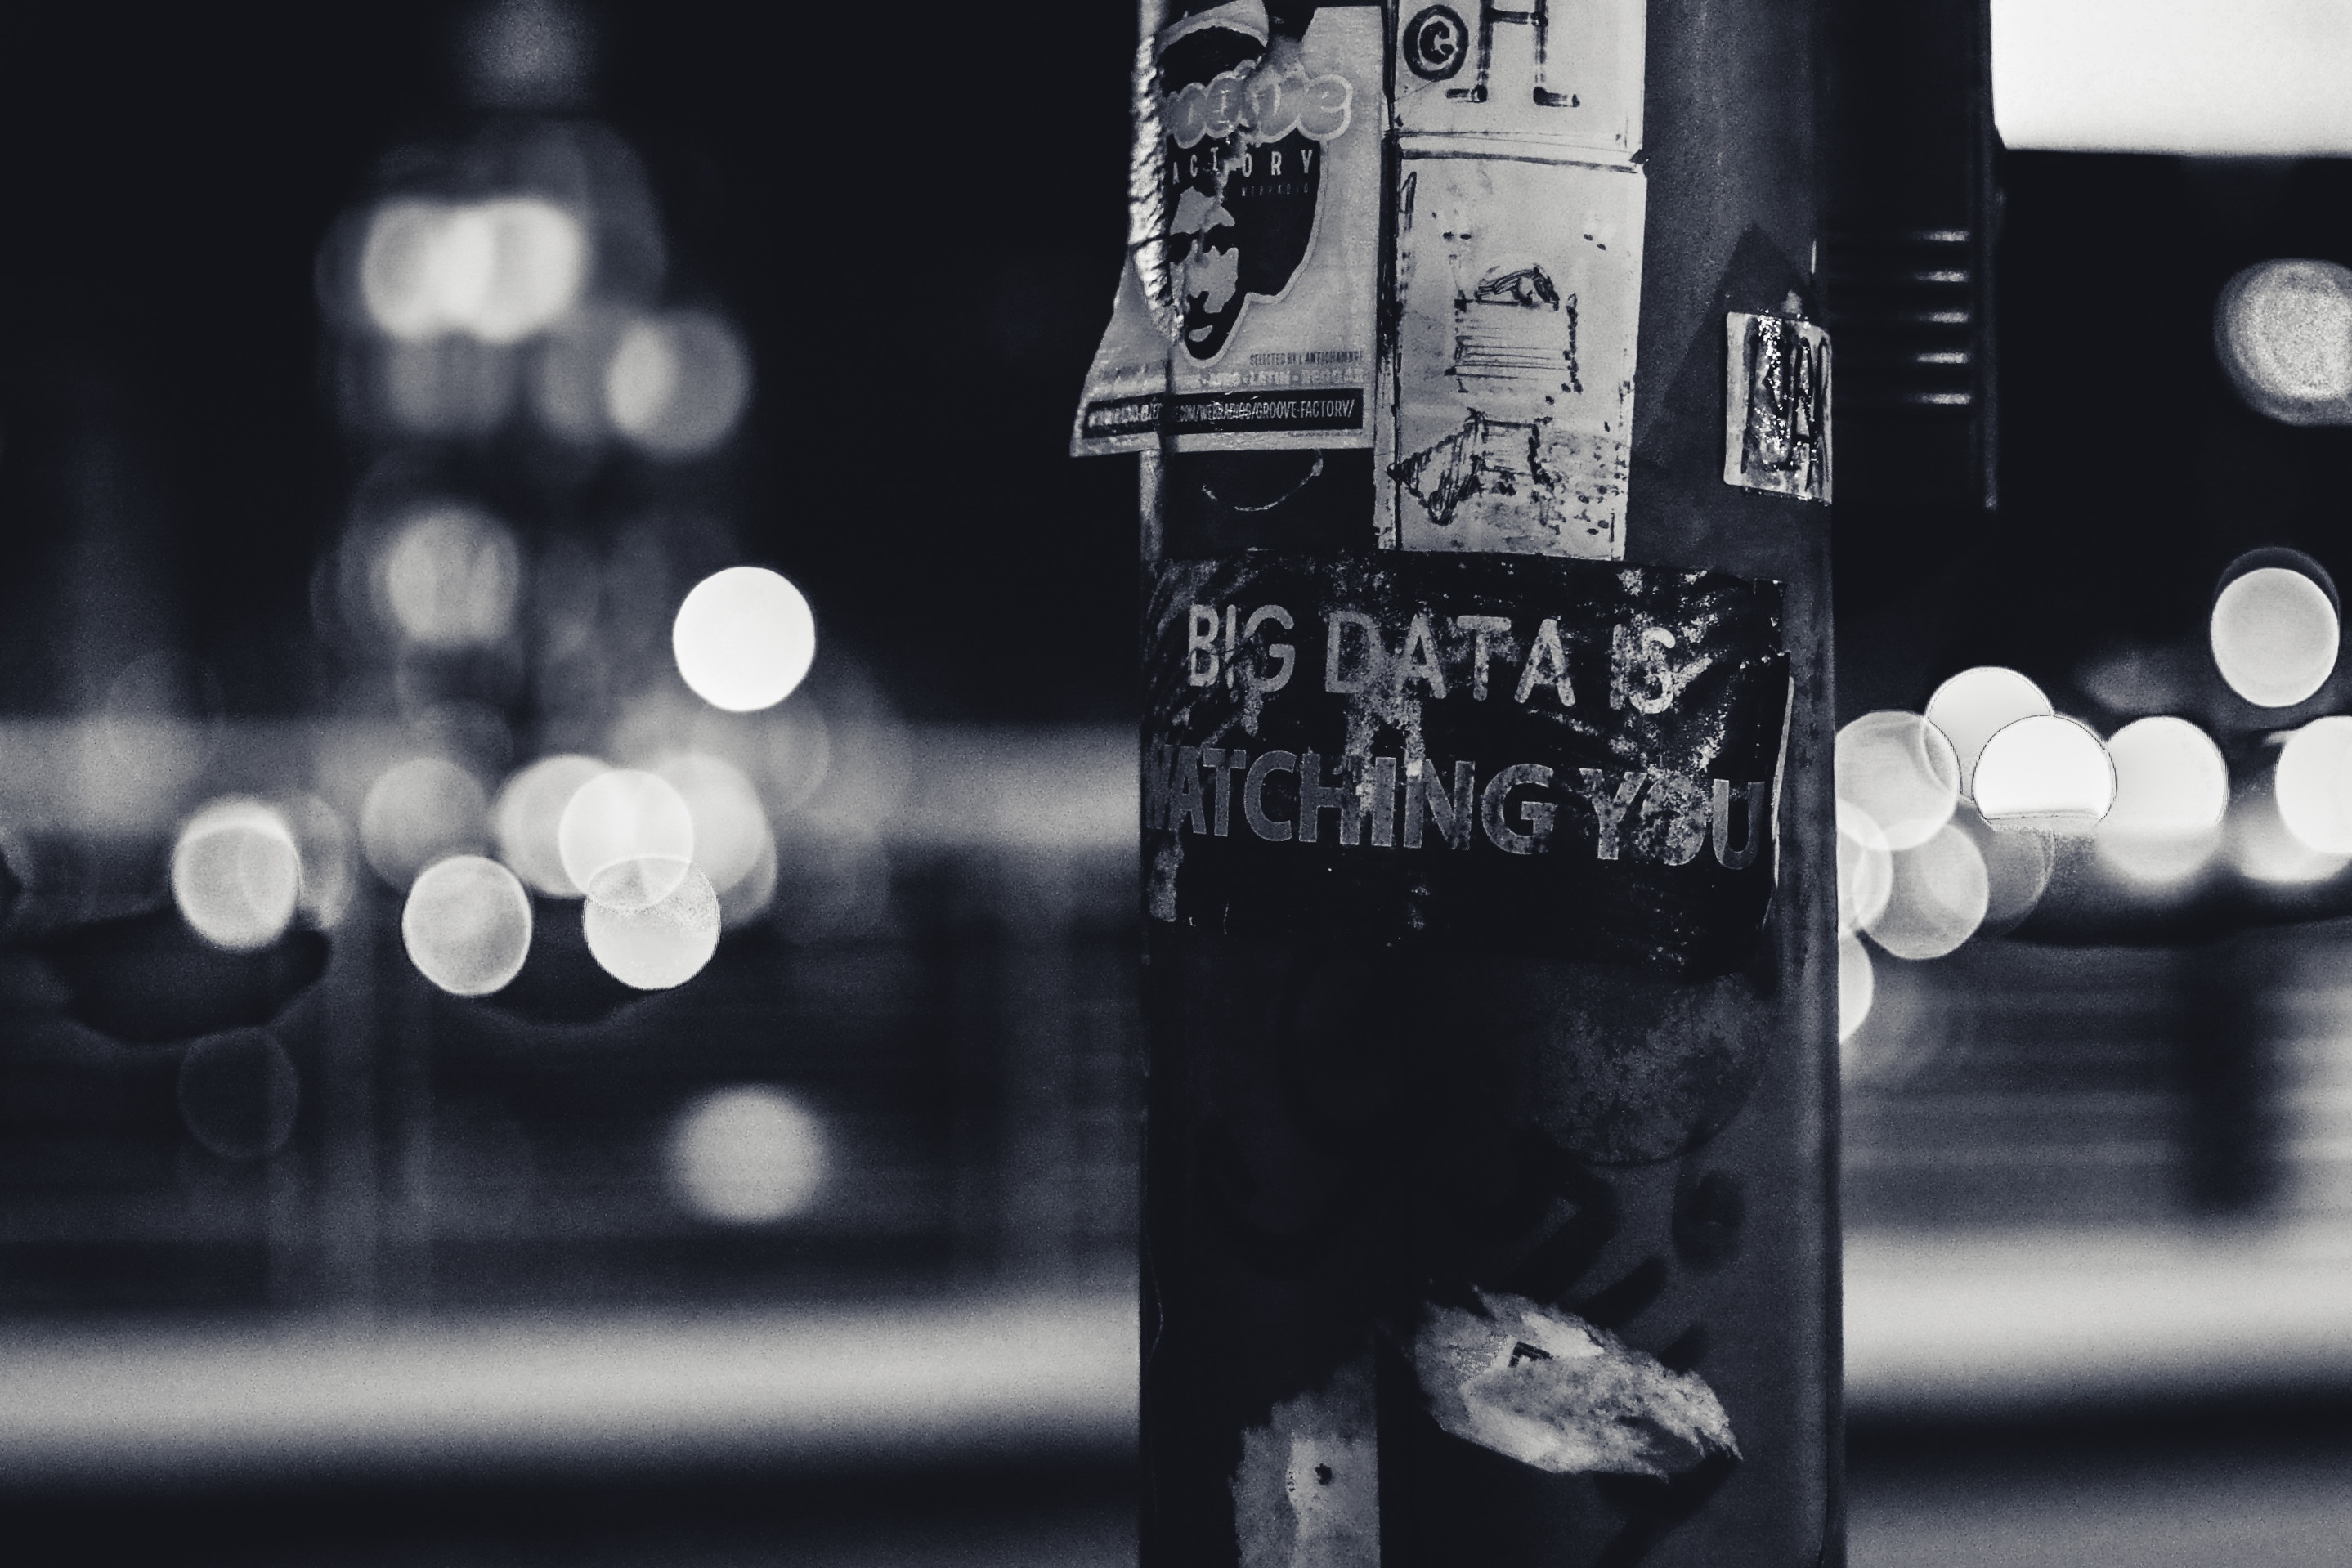
How your data can be used against you
As more details are released about the extent of the damage from Facebook data by the hands of Cambridge Analytica, the world is coming to understand the true power of data. This doesn’t necessarily mean extensive personality data. Even something as simple as Facebook activity in the wrong hands can sway elections. Maybe if you “liked” a product on Facebook, you wouldn’t be surprised if you saw an advertisement for that product. But Cambridge Analytica, with the help of personality modeling, was able to create a behavioral model based on this information that could manipulate your activity. Its hard to visualize the connection between an innocent “like” on Facebook and your actions, but statistics makes this possible.
How does this happen? How could Facebook likes change the outcome of democracy? It is all about association. In 2012, NYTimes Magazine reported that Target could predict if you’re pregnant, down to your due date, with just a few purchases: coco-butter lotion, a large purse, zinc and magnesium supplements, and a blue rug. None of these things explicitly imply pregnancy, but together, they paint a picture. The same picture painting process can be applied to your Facebook data, leveraging powerful machine learning and statistical methods.
Although they are undoubtedly complex, the underlying conceptual process is something humans do everyday. Actually, you probably do this type of analysis all the time without realizing it. For example, what if your friend told you that he or she tried out a new restaurant in Chinatown, and loved the dumplings. Before you know anything else about this restaurant, you can probably assume the food takes an Asian focus with just those two facts. What if your friend told you that he or she tried out a new restaurant in East Village, and loved the noodles? Well, now you might not be so sure. These facts are an example of independent variables, or features. The style of restaurant would be the dependent variable, or result. The world of big data has allowed us to actual put a number on this kind of assumption. For example, if you had a dataset with all restaurants in New York, the type of cuisine, the neighborhood, and whether or not they had noodles and dumplings, we could actually figure out the likelihood that a restaurant was one cuisine or another. Today, with massive amounts of information, we are capable of calculating these likelihoods in a way that we never had before. That is exactly what Cambridge Analytica did with Facebook data — by assessing what users “liked”, they could determine certain psychological traits. Once they had those traits, they could manipulate these individuals with a personalized strategy.
One of the most popular datasets used to understand the power of statistical models is a list of passengers from the Titanic. This dataset is used by Kaggle, a machine learning and data science competition website, to predict survival as an introduction to machine learning. We can actually explore this ourselves, to understand the full power behind statistics. Let’s build a logistic regression model, predicting whether an individual died or survived on the Titanic.
To do this, we will use R. This language is an open source programming language that can run some calculations for us. To execute the commands, click on the “run” button at the bottom of the code window below. You’ll see the results appear in the R Console. Let’s start by exploring the dataset.
Now that we’ve got the hang of the R Script and Console, let’s start building some models. “Regression analysis” is process to determine the relationship between variables. Does a menu with dumplings always imply that it is an Asian restaurant? How about if noodles were on the menu? Regression explores these relationships and associations. In this example, we are exploring whether or not gender, age, and class will affect your likelihood of survival on the titanic.
There are two concepts worth mentioning, and that is a “train” and “test” set. Now, we know the resulting fate of every passenger in both “train” and “test”. In supervised machine learning, we ask the machine to examine some “train” data, and estimate the relationships. Once the machine has estimated relationships through a model, we run that model on “test” data, and it guesses the right answer. We then check how much the model got right through a measure called “accuracy”.
In this next code chunk, we’re assigning “Survived” as our dependent variable — that is, what we are trying to predict. We are also assigning “Pclass” as our independent variable — meaning, does the class of your ticket have a role in survival? Once the model takes a look at the relationship, it will then assign values to each relationship. For example, the model could decide “first = survived” and “third = died”. Then we will test it, and see how well that assumption does.
66% accuracy — not too bad considering we are only considering the passengers ticket class. But, we can probably improve that score. Lets try again with more variables than just class. How about age and gender? This could imply that young children and women passengers were prioritized.
78% is much better. Nearly 8 out of 10 times, our model can predict whether or not an individual would have survived the titanic knowing only 3 pieces of information about that person. Imagine if you had 5 pieces of information, or 10, or 200. With big data and social media, that dataset is possible. Vice reported that “Kosinski continued to work on the models incessantly: before long, he was able to evaluate a person better than the average work colleague, merely on the basis of ten Facebook ‘likes.’ Seventy ‘likes’ were enough to outdo what a person’s friends knew, 150 what their parents knew, and 300 ‘likes’ what their partner knew. More ‘likes’ could even surpass what a person thought they knew about themselves.” Association is dangerous. This is just the start. Your online activity might say a lot more about you than you think.