Xiaoyi Zhang
Air Bottle
What are you breathing?
Anthony J. Deen
Sabine Seymour
Writing and ResearchAndrew Zornoza
Edward C. Jefferson
Air Bottle is an installation art project that apple data visualization strategy on physical form. it creates a simple data visualization system that make a new perspective of air pollution data and how we elevate air pollution int today. I will use 50 glass bottles and present on a rack and each bottle applied my data visualization system.
Concept Statement
Why? The background and problem statement.
Today, we all know China and other developing countries are suffering with serious air pollution problems. But sometime the air pollution is very invisible. We can not see, listen, smell and hear the “illness” of the air ( unless it become really bad) and when air pollution exists and we are breathing the polluted air without notice it. Sadly, behind this invisible pollution, they are many other problems (such as water pollution, lung cancer rate, soil pollution) are caused by polluted air.
How people evaluate air pollution, how to make a space that can let people experience the air pollution problems? what is the best media to connect this problem with art and installations? how There are many questions from me to create a project related to the air pollution.
How we evaluate the air pollution and is this evaluation system accessible?
There are two popular systems of reporting daily air quality: AQI index and PM 2.5 index.
AQI
The AQI is a color code based index for reporting daily air quality. Instead providing the complex data, the AQI focuses on the health effects that might be a concern for people. The index of AQI is from 0- 500, and it uses 6 colors to stand for six levels of air quality of the health concern. The dark red color is hazardous, the purple is very unhealthy, red is unhealthy, orange is unhealthy for sensitive groups, yellow is moderate, and green is good. 
PM 2.5
PM2.5 Atmospheric particulate matter, are the very small pieces of solid or liquid matter that suspended in the air. The PM 2.5 is the matter that is smaller than diameter of 2.5 micrometers. The PM 2.5 is one of the most important indexes of air quality reporting, especially in Asian countries. The PM 2.5 is widely believed to be very dangerous to human health. In 2013, a study involving 312,944 people in nine European countries revealed that there was no safe level of particulates and that for every increase of 10 μg/m3 in PM10, the lung cancer rate rose 22%. The smaller PM2.5 were particularly deadly, with a 36% increase in lung cancer per 10 μg/m3 as it can penetrate deeper into the lungs.
Although the people in China started to pay attention on the PM2.5 index and this evaluation system is widely broadcasted in Chinese media, none of those two evaluation system are widely known in western world. I did a small survey about those air pollution evaluation index with a group of 20 college students this year. Only 2 of them heard about PM 2.5 before ( They are all Chinese students and heard this from Chinese media) Only 1 of them check or ever checked air pollution index.
Interestingly, almost all of them agreed that air pollution is a serious problem for city people.
The complexity of the air pollution index make this evaluation less accessible to people. How to make air pollution data more accessible? How to develop visualization platform that is easy and makes people understand air pollution? This is what I’m going to study and solve from this project.
Who? My target audience:
People live in the urban area and aware of the environmental issues.
People like to explore and visit public installations and public arts.
Parents are looking for an educational experience for their kids about the global environment issues.
How it works?
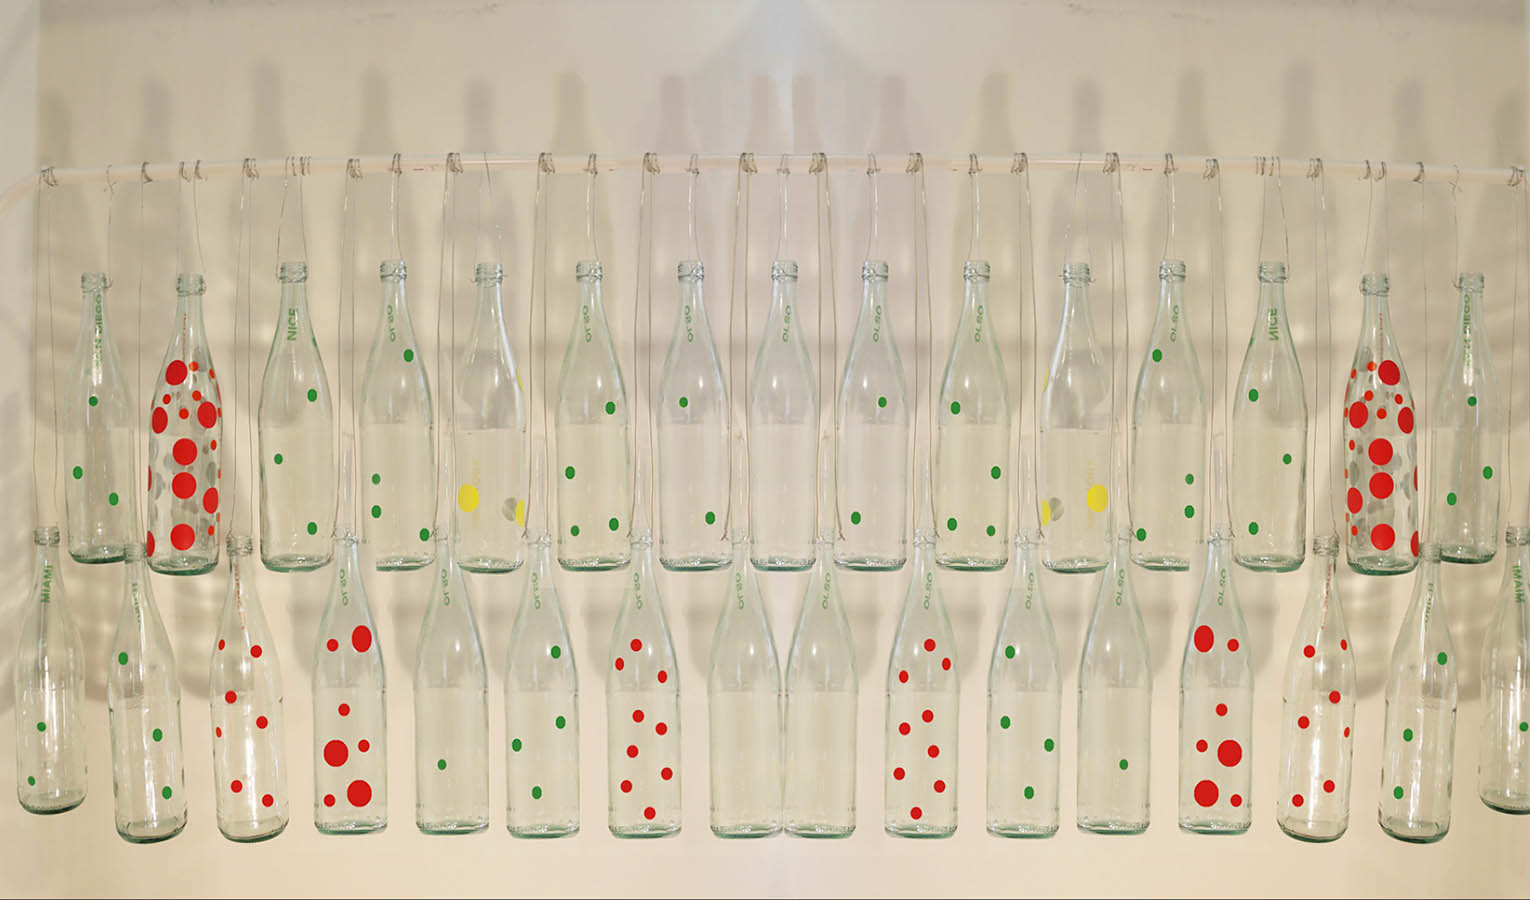
There are three sizes of polka dots that I will use for this project. Each size of polka dot represents different density of the PM 2.5 in the air. The biggest dot stands for 50, the medium size for 10 and the smallest size dot 1. The AQI colors will also apply to the dots. The color of the dots will change with the air pollution data. The six different colors stand for different health concerns because of the air quality. The different colors of the dots also give people a very direct feeling of the level of air quality of each represented city and it is easy to compare the air pollution conditions in different cities. Another very important component is the clear bottles. Each bottle stands for a different city in the world and also stands for the micro-climate in the urban area. The clear bottles can also bring the flat data into 3D form and give people the feeling of floating particulate matter in the air. I chose four cities to apply my concept: Oslo, San Francisco, Los Angeles and Beijing.
I will use 50 glass bottles and present on a rack and each bottle applied my data visualization system.
