My Walk To The Curry Wurst Restaurant
by Olivier Brückner
We have it always with us, the tiny computer in our pockets: the smartphone. It is this piece of wonder, which lets us communicate with anyone around the world, playing interactive games, measuring our apartment without needing a measuring tape, or taking incredible pictures. It is increasingly implemented in our day-to-day, helping us in every aspect of our life. Since its release in 2007, displays sharpened, cameras improved and multiplied, and new sensors added, such as a LiDAR sensor which can 3D scan your surroundings. Improvements enable new apps to arise, anticipating every little step we are taking to make our lives as easy as possible.
A lot of the applications mentioned above use physical sensors to detect our actions or surroundings. They are the components that allow for our smartphones to feel so intuitive. The accelerometer, for example, senses the acceleration and the gravitational force alongside three perpendicular axes. This way, it can detect the position in space, which eventually tells the software in which angle the user holds their phone. Using this information, the phone knows, for example, if it needs to display content in portrait or landscape mode.
But what sensors does a smartphone currently contain? What do these sensors collect to make our lives this easy? How do they interpret the data to anticipate our subsequent actions? And what do they collect and compute without our knowledge and influence, even when disconnected from the internet?
In the following paragraphs, I am going over the different sensors that were added to our intelligent little devices over the years, what they do, and what can be implicated using their data. To make it tangible, I will display an experiment using my smartphone and the data I generated within one hour. This experiment intends to give a feeling of how much granular information we generate, and how hard it is for the human eye to understand it.
Some Stories
Before we go into understanding our smartphones more thoroughly, let’s start with a few examples. Last year Simon Weckert hacked Google Maps. Using 99 smartphones in a handcart, he walked up and down the streets of Berlin to create the illusion of having 99 cars blocking that street, resulting in redirections for other drivers, as the navigation service uses the smartphones’ location data to anticipate traffic jams and routes (Weckert 2020). It’s a simple yet powerful example of how services use our smartphones to improve. We can opt out of this smartphone location tracking. Still, on the other hand, Google uses this data to improve predictions for traffic jams, opening hours of shops, and even the crowdedness of public transportation.
Even without having GPS activated, the smartphone sensors can be used to anticipate the user’s movement. Running machine learning (ML) algorithms over retrieved patterns of acceleration and location result in interpretations that allow locating people only from their start point of a trip and their movement by using the acceleration forces in each direction and calculating the equivalent distance it resulted in (Hernández Sánchez et al. 2018).
The Apple AirTag, which got announced on April 20th, is a perfect example of using this technique. It can precisely tell its user where it is located. Yet, it does not have a GPS sensor built-in. Even though a Bluetooth signal can give an approximate location, it is not usable for precise locations—last year, I was experimenting with this for a client project at IDEO. However, it has an accelerometer built-in, probably recording the last movements when it lost its connection to the user’s smartphone. There is no other logical reason, to me, to include an accelerometer in this device (Apple 2021).
What can the smartphone collect/sense
The accelerometer is one piece of many. Smartphones contain many more sensors than the original iPhone presented by Steve Jobs in 2007, which had only an accelerometer and a proximity sensor built in, not even GPS.
To understand what our smartphones are capable of, we first need to understand which sensors are built into these powerful computers. Here is a brief list of the sensors that are included in my experiment:
- GPS — Typical location data in the form of latitude and longitude.
- Accelerometer — To check the acceleration in three perpendicular axes (x, y, and z). Its data is used to understand in which direction your phone is titled, for example.
- Gyroscope — This sensor understands in which direction you point your phone. In comparison to the accelerometer, it can track your rotation alongside an axis.
- Barometer/Altimeter — This one can check the air pressure. This way, it can measure the altitude. This information can be used to read how many floors the smartphone has been taken up or down.
- Magnetometer — This sensor can detect a magnetic field and senses this way the absolute orientation of the phone, like a compass.
- Microphone — The microphone is a crucial element of the smartphone, especially the phone bit. But when not telephoning, it still can collect noise data around the phone constantly. An example of that is when one is using the voice assistant by simply calling it.
How can Machine Learning make sense of smartphone data?
To understand why this is relevant, let’s have a brief look at how machine learning works. Let’s take an example. We have our hypothetical user who is walking along a street, and we can see the accelerometer data. If we see that the acceleration is oscillating in a specific rhythm, we could recognize the user’s leg swinging back and forth as the user is walking. If the values are still, it means the phone—or leg—is not moving anymore, and our user could be standing. You can test this in the data I recorded below.
With this simple information, we can already figure out when our user was moving and when not. Now our smartphones contain many more sensors, giving us information about the altitude, so for example, the floor we are currently on, the exact location through GPS coordinates, and much more. Combining these datasets gives us very detailed information. For example, how fast the user was walking from A to B, where this A, B, and all steps in between were, if they were going uphill or downhill, if the phone was picked up during this time, and much more.
If one person could compare all of this sensor information, one could interpret this data and understand what is going on. The interpretation could even result in something like: “User X walked home from work, a little bit slower than usual, and at position Y, they stopped, picked up their phone for one minute, and continued walking, a little faster.” Keep in mind here that this is only the sensor data. The software data is not yet considered! The software would give even additional information about what was looked at on the phone while standing, if X was listening to music, and if so, which song. This information can be used, for example, for your phone’s smart suggestions. But that would exceed what I want to highlight in this text.
Of course, this is far more information than a human being could compare and process, even for just one user. That is when ML comes into action. All this data is put into one database and gets compared. If a pattern occurs that happened before, the system can recognize it and make assumptions about the next steps or detect when something does not happen as usual and react to that. The more data is generated—the more the smartphone is used—the better the model gets trained as more examples of habits are involved. Involving your personal dataset, but also from other users. Comparing the datasets can even result in understanding our emotions and how a user reacts to an advertisement. Not only on the device but even on posters in the streets. Especially, when including wearables and their heartbeat sensors (Entis 2015).
My Experiment
To give a more tangible and real example, I started an experiment. There are two things that I wanted to pursue to get relevant data from my smartphone: Getting the data held from my smartphone manufacturer and seeing what can be interpreted out of collecting all the data from my smartphone’s sensors. These two parts should help me understand what a provider can know about me.
My GDPR experience — collecting from Apple and Google
I am based in Europe. The GDPR law applies to my services, so I requested all my data from Google and Apple—I have been an iPhone user since 2011; hence this would be my most important data source. As I am also using services like Google Maps and Chrome, I was interested in this information and what potential hardware data they might have.
The Apple data was very underwhelming—which is a good thing! It mainly consisted of information about purchase histories and data that is actively stored in the cloud. However, I could not retrieve my data from the services “Wallet” and “Maps,” which seem to be the most crucial sets for my experiment.
Knowing that the iPhone stores “significant locations,” I was puzzled at first why this data did not show up. Browsing through my iPhone’s settings, they obviously were still tracked and stored. Their policy is stating the following:
Significant Locations: Your iPhone and iCloud connected devices will keep track of places you have recently been, as well as how often and when you visited them, in order to learn places that are significant to you. This data is end-to-end encrypted and cannot be read by Apple. It is used to provide you with personalized services, such as predictive traffic routing, and to build better Memories in Photos.(Apple 2020)
Even though this data is collected, it is not directly sent to Apple’s servers but stored on your device to improve services.
Google’s data was far more thorough. It displayed every location search I ever took in their “Maps” service. It is pretty extensive, giving Google a lot of information, but it is not related to the hardware’s sensors, hence not quite what I was looking for.
Collecting my smartphone data for an hour
Retrieving my data from the smartphone’s provider did not get me where I wanted. So, time to explore my second approach: Collecting the data myself to visualize its potential. Using the app SignalLog allowed me to simply start collecting (Thomas 2017).
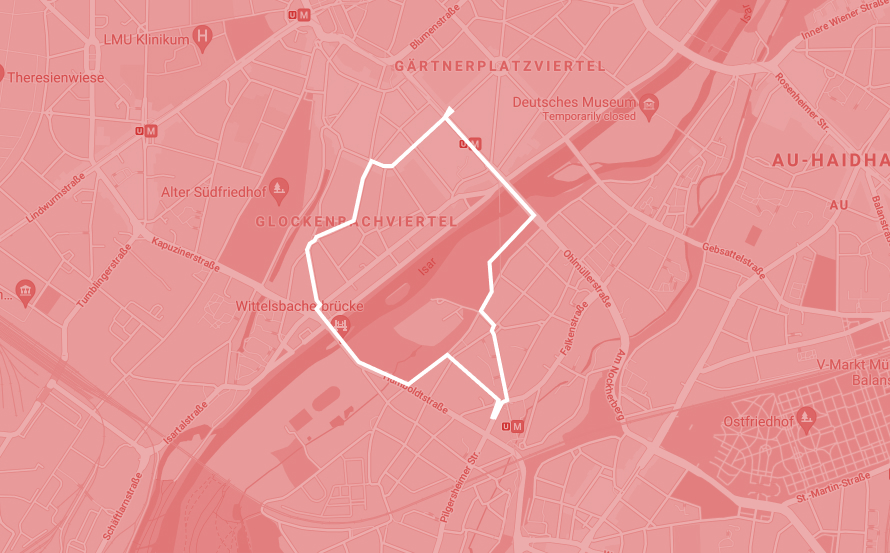
Using an iPhone 12 Mini, I collected all the sensor data of one walk from my apartment, together with my flatmates, to our local Curry Wurst restaurant. It was a one-hour trip, consisting of mostly walking, waiting at traffic lights, taking a picture of my flatmate, and the trip back, up until I left the phone back on the table.
This one hour of data resulted in a 215.3 MB JSON file—to put this in context, a JSON file is a plain text, so relatively small. Usually, huge files that I would work with consist of about 1 MB of data—about a third of a regular photo. I decided to shorten the data set, but even after that, it was too big for my system to work with—just to put in perspective how much data has been collected in this short time. I decided to shrink it even more, selecting only one entry per second and specific data points—before that, it was at 30 entries per second—and only choosing half an hour.
To show you the extensive data, here is one data entry—to put in perspective, there are a total of 63,730 entries in my test sample of this one hour—of the recording:
[
{
  "accelerometerAccelerationX" : "-0.110947",
  "accelerometerAccelerationY" : "-0.454269",
  "accelerometerAccelerationZ" : "-0.900040",
  "accelerometerTimestamp_sinceReboot" : "174394.688337",
  "activity" : "walking",
  "activityActivityConfidence" : "2",
  "activityActivityStartDate" : "2021-04-09 12:30:56.955 +0200",
  "activityTimestamp_sinceReboot" : "174379.531756",
  "altimeterPressure" : "95.674484",
  "altimeterRelativeAltitude" : "1.294739",
  "altimeterReset" : "0",
  "altimeterTimestamp_sinceReboot" : "174391.161097",
  "avAudioRecorder_Timestamp_since1970" : "1617964272.103847",
  "avAudioRecorderAveragePower" : "-25.908628",
  "avAudioRecorderPeakPower" : "-17.750378",
  "batteryLevel" : "0.910000",
  "batteryState" : "1",
  "batteryTimeStamp_since1970" : "1617964272.078029",
  "deviceID" : "my_iOS_device",
  "deviceOrientation" : "1",
  "deviceOrientationTimeStamp_since1970" : "0.000000",
  "gyroRotationX" : "-0.199038",
  "gyroRotationY" : "-0.250843",
  "gyroRotationZ" : "0.050598",
  "gyroTimestamp_sinceReboot" : "174394.663492",
  "IP_en0" : "",
  "IP_pdp_ip0" : "",
  "IP_Timestamp_since1970" : "0.000000",
  "label" : "0",
  "locationAltitude" : "516.619629",
  "locationCourse" : "233.150787",
  "locationFloor" : "-9999",
  "locationHeadingAccuracy" : "12.776193",
  "locationHeadingTimestamp_since1970" : "1617964272.094853",
  "locationHeadingX" : "-13.511061",
  "locationHeadingY" : "-31.109329",
  "locationHeadingZ" : "-36.466125",
  "locationHorizontalAccuracy" : "18.383077",
  "locationLatitude" : "xx", // obscured by Author
  "locationLongitude" : "xx", // obscured by Author
  "locationMagneticHeading" : "93.705368",
  "locationSpeed" : "0.000000",
  "locationTimestamp_since1970" : "1617964271.999422",
  "locationTrueHeading" : "97.411057",
  "locationVerticalAccuracy" : "3.965190",
  "loggingTime" : "2021-04-09 12:31:12.114 +0200",
  "logSampleNr" : "1",
  "magnetometerTimestamp_sinceReboot" : "174394.641422",
  "magnetometerX" : "-4.286499",
  "magnetometerY" : "-28.471375",
  "magnetometerZ" : "-254.098221",
  "motionAttitudeReferenceFrame" : "XArbitraryCorrectedZVertical",
  "motionGravityX" : "-0.076988",
  "motionGravityY" : "-0.440247",
  "motionGravityZ" : "-0.894570",
  "motionHeading" : "-1.000000",
  "motionMagneticFieldCalibrationAccuracy" : "2.000000",
  "motionMagneticFieldX" : "-13.437623",
  "motionMagneticFieldY" : "-31.173965",
  "motionMagneticFieldZ" : "-36.311996",
  "motionPitch" : "0.455874",
  "motionQuaternionW" : "0.955005",
  "motionQuaternionX" : "0.229547",
  "motionQuaternionY" : "0.004821",
  "motionQuaternionZ" : "0.187752",
  "motionRoll" : "-0.085850",
  "motionRotationRateX" : "-0.112700",
  "motionRotationRateY" : "-0.179058",
  "motionRotationRateZ" : "0.055314",
  "motionTimestamp_sinceReboot" : "174394.649834",
  "motionUserAccelerationX" : "0.084892",
  "motionUserAccelerationY" : "-0.079117",
  "motionUserAccelerationZ" : "-0.026695",
  "motionYaw" : "0.408170",
  "pedometerAverageActivePace" : "0.000000",
  "pedometerCurrentCadence" : "0.000000",
  "pedometerCurrentPace" : "0.000000",
  "pedometerDistance" : "0.000000",
  "pedometerEndDate" : "null",
  "pedometerFloorsAscended" : "0",
  "pedometerFloorsDescended" : "0",
  "pedometerNumberOfSteps" : "0",
  "pedometerStartDate" : "null"
}
]
What surprised me at first, was that even though it recorded every sensor data in this high frequency for an hour, the battery did not get drained more than usual. This raises the curiosity that all sensors are constantly turned on and recording in the background if wanted by the user or not.
Some of these datapoints were surprising to me as well. For example, the ML chip on the phone already outputs an activity label and confidence for it. Also, each step has a calculation of the pedometer. Not only is a step counted, but even the pace, cadence, and distance are measured. Imagining that this whole set of data—83 unique data points—is collected in a frequency of 30 entries per second is quite astonishing, especially, keeping in mind that these are only the phone’s hardware sensors, without the camera. All the hardware outputs, like the screen or speakers, and software, like iOS, have not even been considered yet. This shows the sheer amount of data our smart devices collect and compute at the same time.
My Data
Just taking a glimpse at this data reveals a lot of my actions in that hour. In the raw data—for example, at the accelerometer data, as mentioned above—one can already see when I moved or when I stopped. The already precomputed data helps it even more to make the whole sensor data more understandable for humans. The pedometer data, for example, already calculates the average paces I had at each moment making it directly readable for us humans. To see what speed I had at which moment in time—when I got a bit faster, or directly showing when I stopped—and not only making us guess it.
This is already a perfect example of how ML helps us to interpret data. The accelerometer, gyroscope, and magnetometer data, each one of them very hard to make sense out of, or let alone even understand what it is displaying right away. The computed pedometer data provides us pieces that are easier to digest. When we think of ML, we often have generated images in our head or image recognition that is not labeled correctly. But one has to understand that image handling is the most challenging part for a machine.1 This sensor data, in contrast, is elementary for a computer to read. The numeric values are the language of a machine, making use of its immense calculating power. Once it figured out the rules and patterns of the combination of the single sensors, it is a piece of cake for a computer to translate this into another data set.
Now imagine, if the hard to understand accelerometer, gyro sensor, and magnetometer data are transformed into this easier to understand pedometer data, what other tiny nuances it would be able to detect if it would consider all other data points as well, comparing them with different situations and more users than just myself. It is able to find correlations of values we would not even think of. Apple Health is even capable of knowing if you are limping, even just slightly, only by using your phone (Smith 2021) and just imagine, it is only using one phone, hence one leg to calculate this information! It is remarkable and scary at the same time to think of what these few sensors already can reveal about our behavior.
Suppose we spin this thought a little further, each literal step we take, or even if we do not move at all, by still having our smartphone with us. In that case, we collect valuable environment and behavior data from the most fundamental part of our lives: ourselves. Website trackers already collect the tiny differences in our behavior, how long we hover over a button, or which post we spend more time with by scrolling through. We can influence our software behavior quite a lot in comparison to our physical behavior. We can decide which websites to visit if we want to use social media or we can add blockers. It becomes a lot harder if we want to implement these precautions in our real, physical lives. With each added sensor, our smartphones understand our lives a little bit better. Where we are, how we walk, when we walk, at which floor we live, how noisy our street is, and much more.
We profit from this knowledge by getting another convenience layer on services and apps. But where does this end? What do the smartphone manufacturers learn about us that we do not know? If Facebook already knows its users better than they do themselves, just by the likes and reactions they have taken, then how good do smartphones know us, following literally everywhere we are going?
I do not have an answer to these questions. You could escape from this tracking madness by using a feature phone instead of a smartphone, but then again, this would limit our daily lives in today’s world drastically. Yet, I hope that knowing what your smartphone is capable of, additionally to the software layer, gives you a better understanding of it.
Olivier Brückner is a first-year MFADT student. He is fascinated by the space between physical and digital. — Twitter
References
- Apple (2020). Location Services & Privacy. Accessed on April 12th, 2021 at https://support.apple.com/en-us/HT207056
- Apple (2021). AirTag. Accessed on April 21th, 2021 at https://www.apple.com/airtag/
- Entis, Laura (2015, July 31st). Ads can now tell how fast your heart is beating, The Guardian. Accessed on April 12th, 2021 at https://www.theguardian.com/lifeandstyle/2015/jul/31/biometric-data-apple-wimbledon-facebook-mindshare-affectiva-unilever-coca-cola-mars
- Hernández Sánchez, Sara; Fernández Pozo, Rubén; Hernández Gómez, Luis A. (2018). Estimating Vehicle Movement Direction from Smartphone Accelerometers Using Deep Neural Networks. Accessed on April 12th, 2021 at https://www.ncbi.nlm.nih.gov/pmc/articles/PMC6111255/
- Madge, Robert (2017, August 17th). Five loopholes in the GDPR. Accessed on April 12th, 2021 at https://medium.com/mydata/five-loopholes-in-the-gdpr-367443c4248
- Smith, Niel (2021, February 19th). Monitor your injury recovery and mobility using your iPhone, MyHealthyApple. Accessed on April 12th, 2021 at https://www.myhealthyapple.com/monitor-your-injury-recovery-and-mobility-using-your-iphone/
- Thomas, Bernd (2017). SensorLog: Log and Stream Sensor Data. Retrieved on April 9th, 2021, from https://apps.apple.com/us/app/sensorlog/id388014573
- Weckert, Simon (2020). Google Maps Hack. Accessed on April 12th, 2021 at http://www.simonweckert.com/googlemapshacks.html
-
Move Lab (back then called “moovel lab”) did in 2017 an enjoyable project to display how a self-driving car “sees.” It is a fun way to understand how machines see and translate images into their language. ↩